Users can see investment data in a monthly, time-series fashion throughout Standard Metrics and its APIs.
Investment Data will be useable in:
The Company Metrics Tab
Calculations
The API
Excel Plug-in
Tear Sheets
Company Metrics Tab
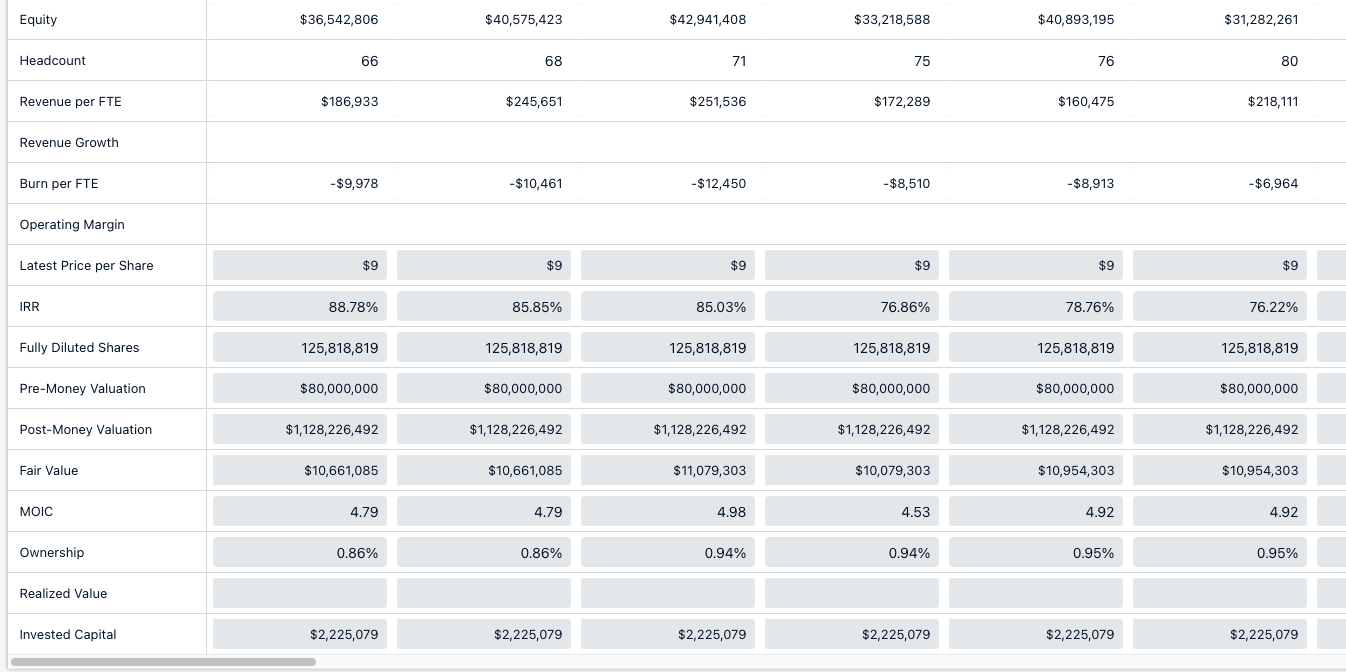
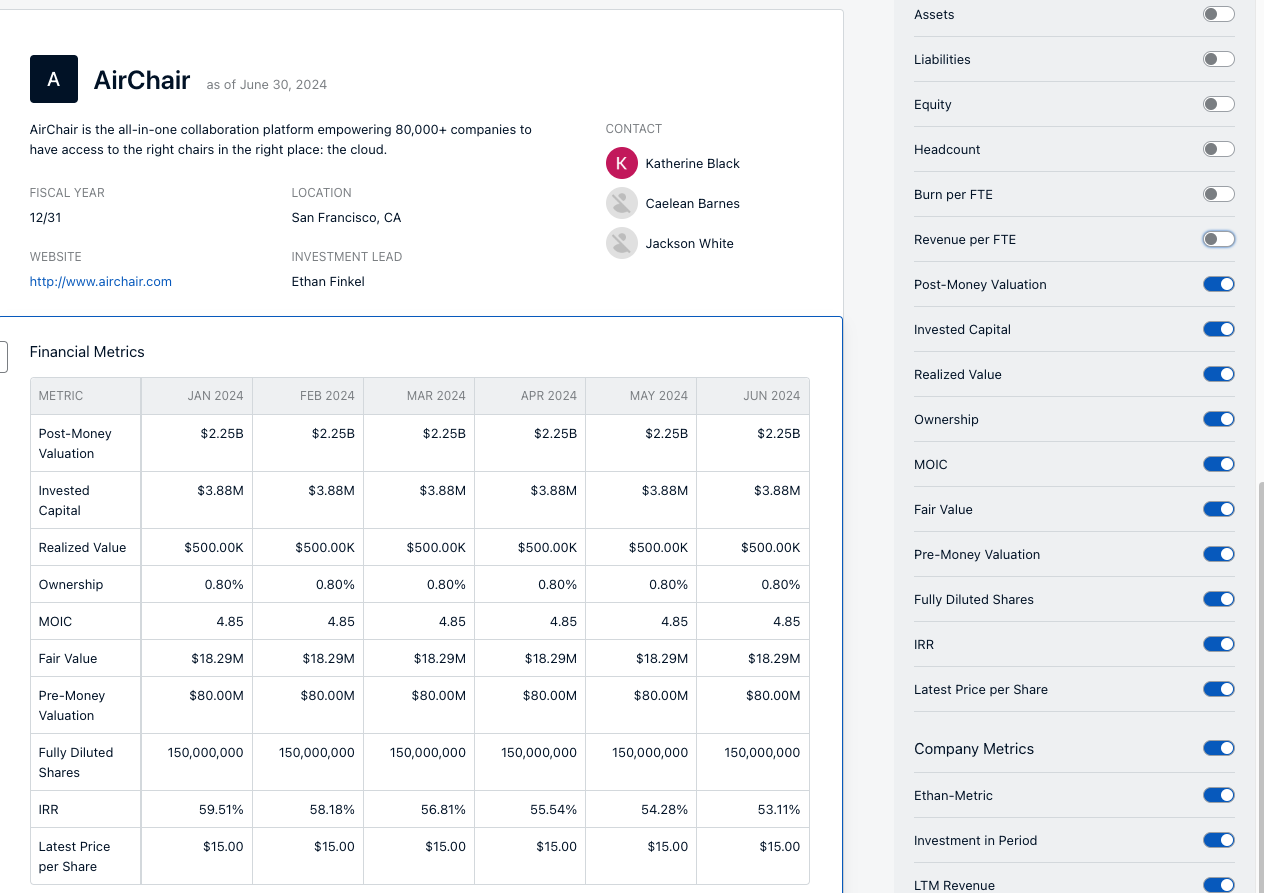
Users can pull company level investment data into the company metrics tab alongside their existing metrics. This allows investment data to be displayed in a time series format and answer questions like “What was our valuation for Airchair QoQ?”
The image below shows how investment data period over period is displayed in the metrics tab.
Calculations
When creating a calculation, users can use the new investment data metrics just like they would any other metric.
Example:
{Ownership} will return ownership
{InvestmentAmount} will return investment amount
{PostMoneyValuation} will return post money valuation.
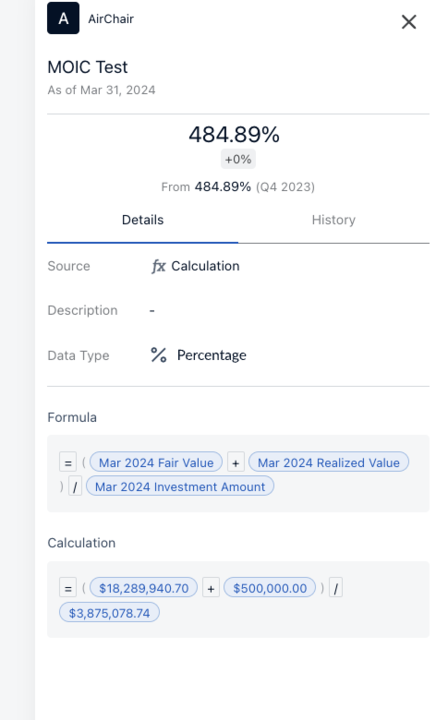
The example below shows MOIC being calculated using investment metrics and with the calculation shown in the DDT.
API
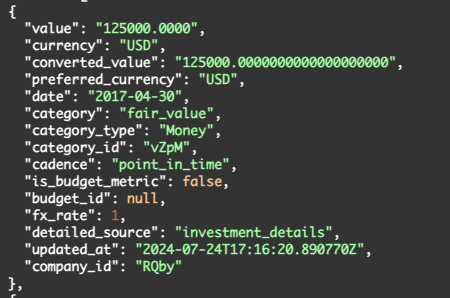
When querying the /Metrics endpoint, users will get investment data metrics back for their companies just like they do Datums.
This is the API response for an investment data category:
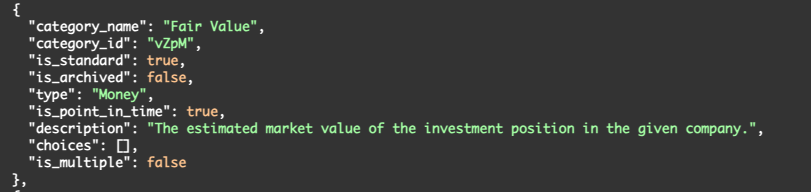
Here is the result of searching for an investment data value:
Excel Plug-in
Users will be able to pull investment data in the excel plug-in just like they would any other metric with our SM.GET syntax.
=SM.GET(”Airchair”, “ownership”, “monthly”, “2023-12-31”) would return ownership for airchair.
All investment data metrics available in the app are available in Excel.
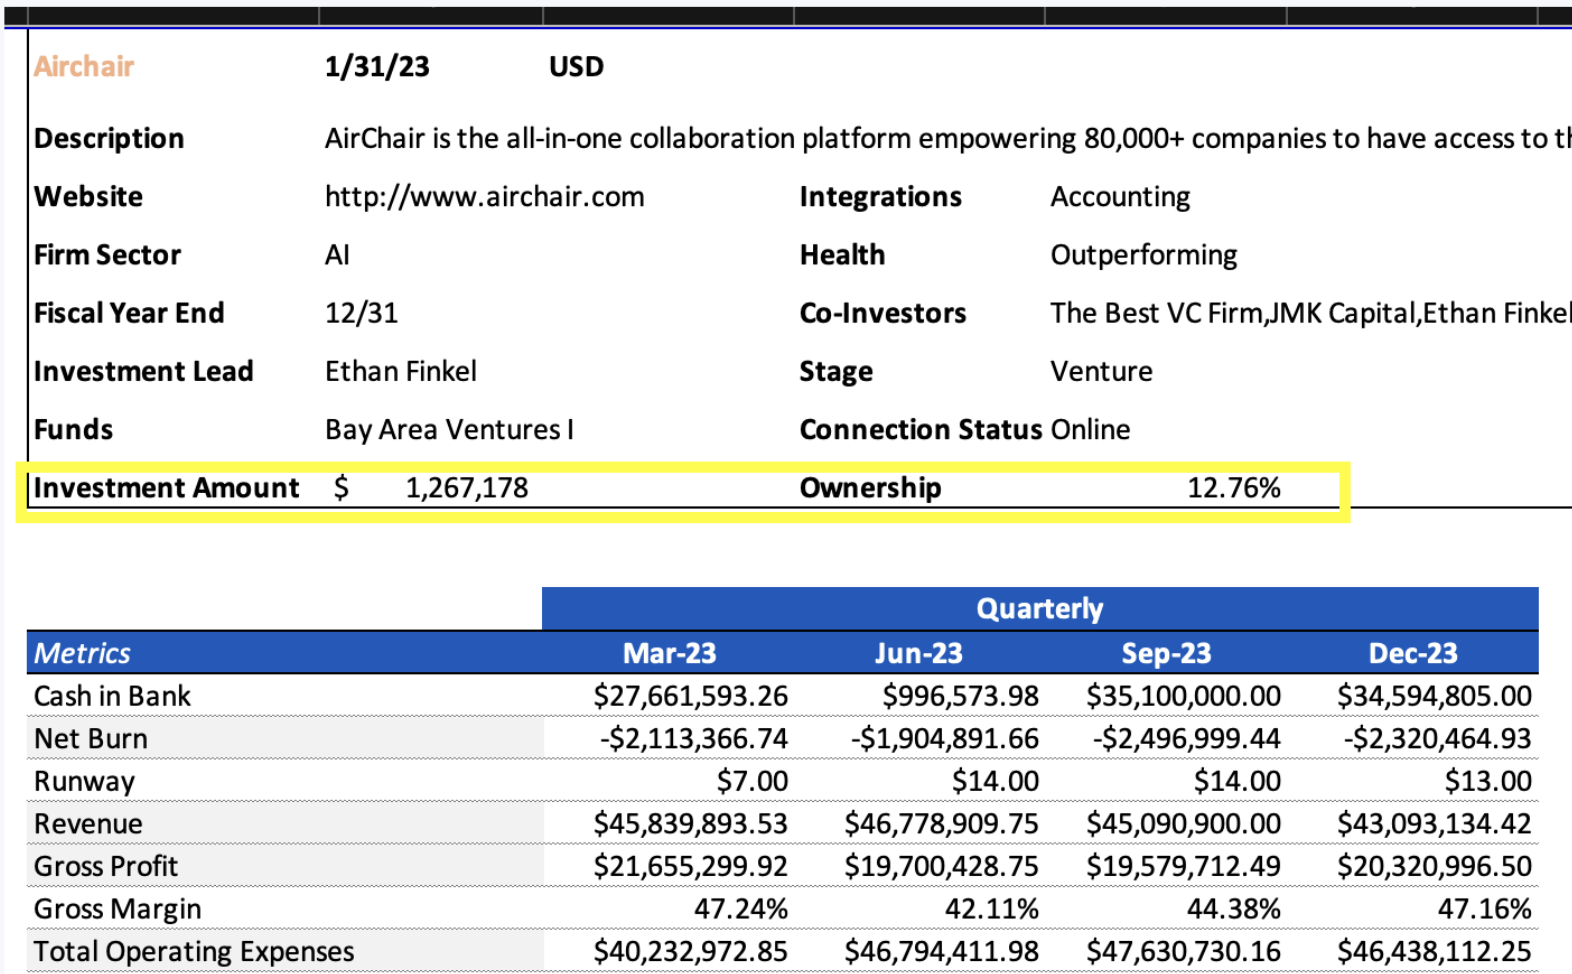
Tear Sheets
Users can select investment data as part of their metrics block for companies and view investment data alongside other metrics like Revenue or Runway.
Benchmarking
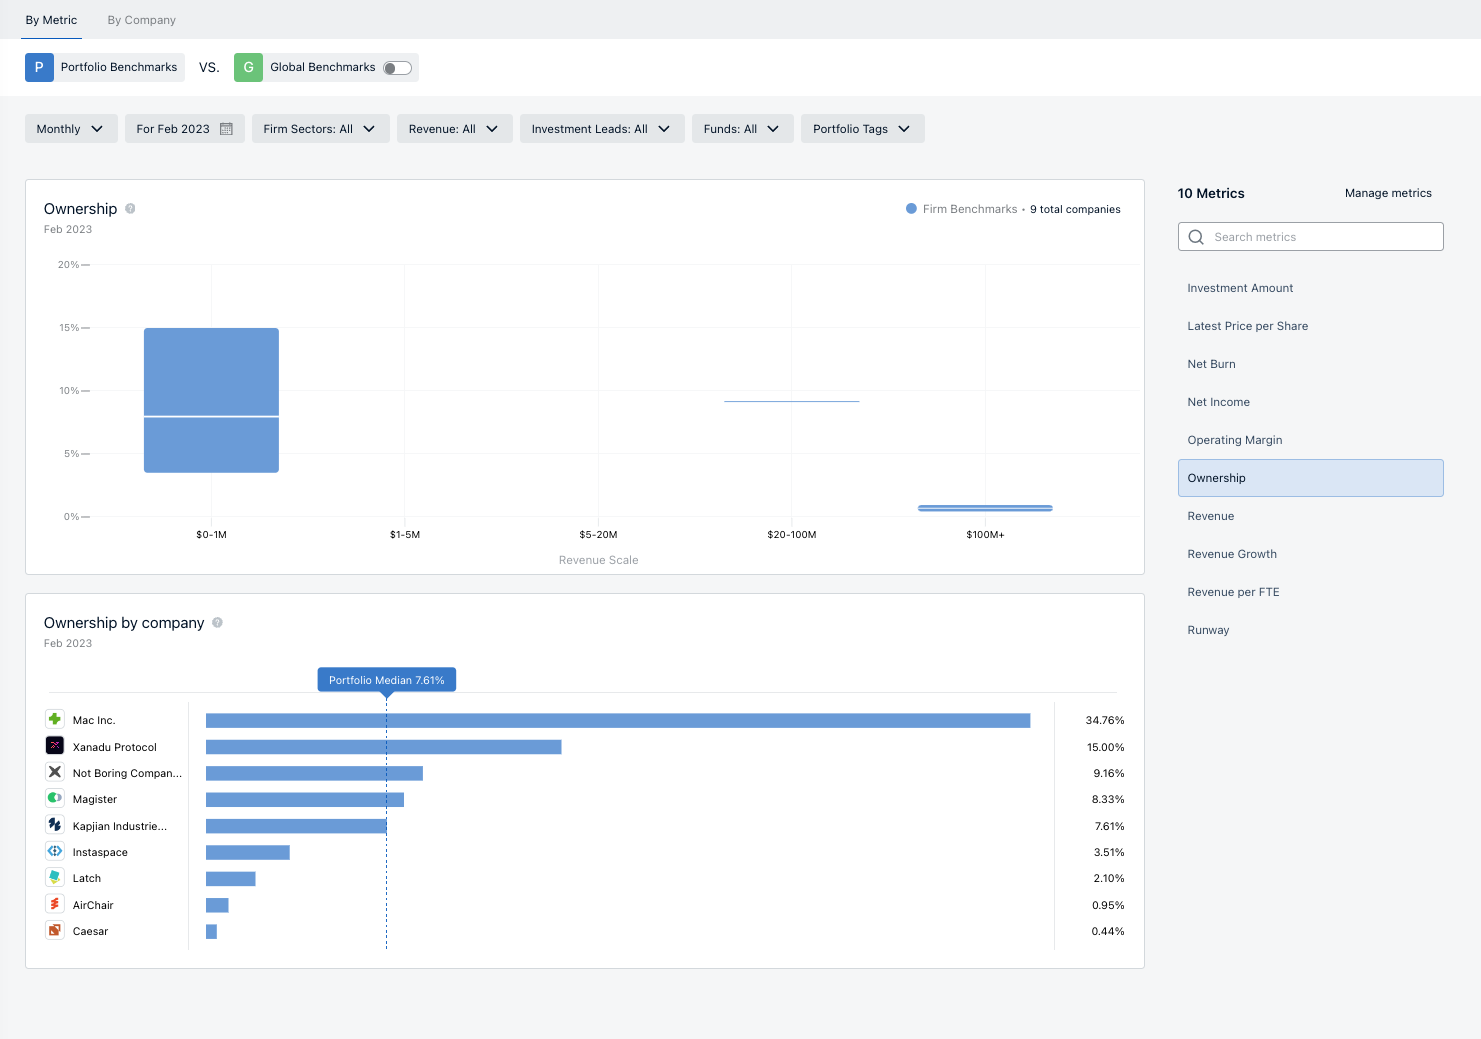
Users can use investment data datums in benchmarking just like they would any other category. Investment metrics are only available for portfolio benchmarking and are not available in global benchmarking.